Connect Demeter to AI tools

Access to terabytes of climate, satellite and other agricultural datasets within seconds.

Claude
ChatGPT
Claude Code
Codex
Antigravity
Grok

Ask anything

Once connected, ask about individual fields, whole regions, crops, climate and more.

Demeter connected
Show Spain’s standing olive area by year of planting, and break it down by exposure to rising summer heat stress.
Found 2.7 million olive groves covering 2.4 million ha
Read summer heat-stress hours at every grove since 2000

Heat stress here means summer hours above 30 °C. Measure exposure by how fast those hours have risen at each grove since 2000, and split the groves into quarters from slowest to fastest?

Yes.
Split 2.4 million ha by planting band and heat-stress quarter
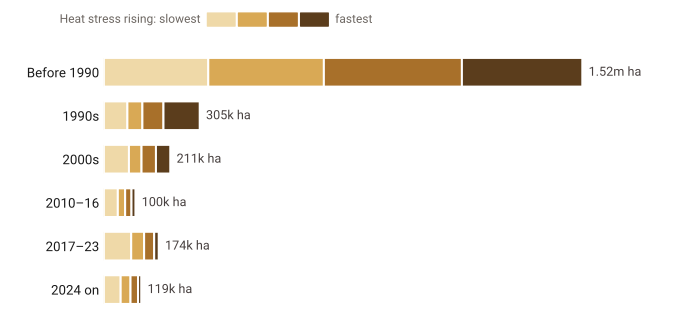
Stacked horizontal bars of olive area by planting band, split into four quarters of heat-stress rise. Before 1990: 1.52 million ha; 1990s 305 thousand; 2000s 211 thousand; 2010–16 100 thousand; 2017–23 174 thousand; 2024 on 119 thousand.

Groves planted before 1990 make up 1.5 million of the 2.4 million ha.

Show each band as shares.
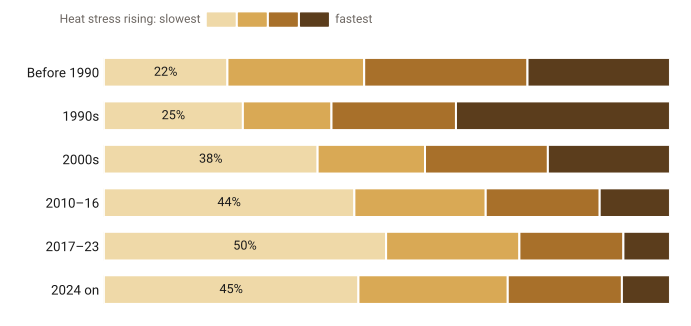
The same bars as shares of each band. The slowest-rising quarter holds 22% of pre-1990 area, 25% of the 1990s, 38% of the 2000s, 44% of 2010–16, 50% of 2017–23 and 45% of 2024 onwards.

Half the olive area planted since 2017 sits where summer heat is rising slowest, against a fifth of the pre-1990 groves.
Demeter connected
Benchmark the health and management quality of this orchard against its same-age peers in the irrigation district over the past 10 years.
Found the irrigation district: Cinco Reis e Trindade
Found 45 almond orchards there planted 2016–18

The district is small enough that its orchards share almost the same weather. Rank the weather against the 614 same-age almond orchards across Beja instead?

Yes.
Ranked canopy level and evenness across the 45, and the weather across the 614
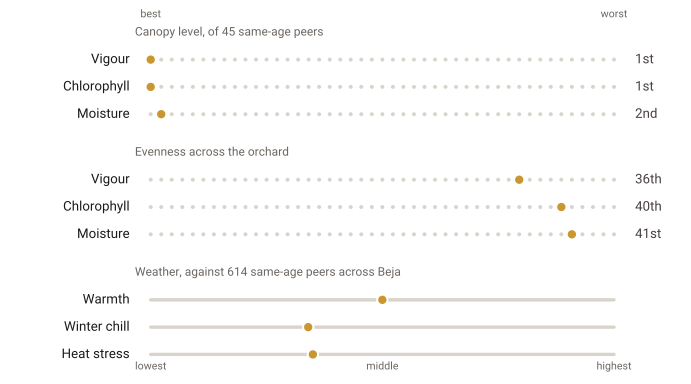
Dot strips ranking the orchard among 45 peers: 1st, 1st and 2nd for canopy level; 36th, 40th and 41st for evenness. Its warmth, winter chill and heat stress sit near the middle of 614 Beja peers.

It ranks top of 45 for canopy vigour and chlorophyll and second for moisture, but between 36th and 41st for evenness across the orchard. Among Beja peers its warmth, winter chill and heat stress are all middling, so weather doesn’t explain the lead.

Demeter connected
List avocado orchards over 10 ha in the Iberian Peninsula that are in the top quartile for orchard ramp-up and have minimal frost exposure.
Found 170 avocado orchards over 10 ha in Spain and Portugal
90 were planted 2016–22, young enough to measure ramp-up

Measure ramp-up as the canopy reached by the third and fourth season after planting, and minimal frost as no spring frost in the last ten years?

Yes.
Ranked the 90 on ramp-up and checked spring frost at each

23 orchards, 354 ha. Frost barely separates them: 89 of the 90 had no spring frost in 2016–25, so ramp-up does the sorting.

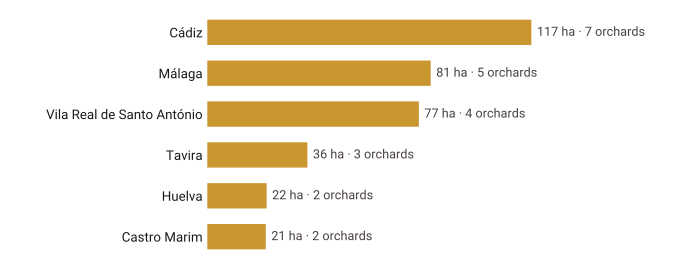
Hectares meeting the criteria by area: Cádiz 117 ha, 7 orchards; Málaga 81 ha, 5; Vila Real de Santo António 77 ha, 4; Tavira 36 ha, 3; Huelva 22 ha, 2; Castro Marim 21 ha, 2.
FieldAreaPlantedWhere
a1ee5c26…11.1 ha2022Tavira
49f8e277…17.8 ha2019Cádiz
849bb20c…25.2 ha2017Málaga
d3ef63bb…19.0 ha2020Vila Real de Santo António
ea49b9b0…13.6 ha2019Tavira
60d2a736…13.9 ha2021Málaga
5481baab…27.5 ha2017Vila Real de Santo António
e18ddc24…10.7 ha2021Castro Marim
+ 15 more
Export it as a spreadsheet.
avocado_shortlist.csv23 rows
Demeter connected
How unusual was the April 2025 frost across Turkey’s hazelnut belt, compared with each area’s own history?
Read hourly temperatures across the belt, Sakarya to Trabzon, for every April since 2000
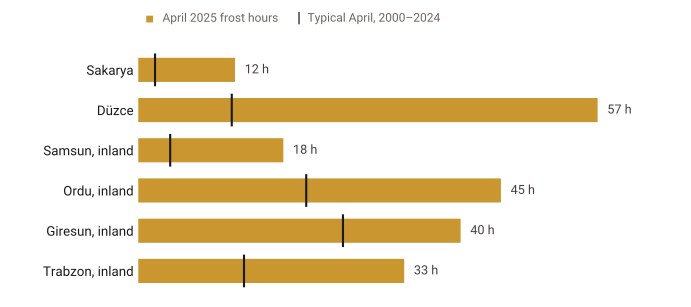
Bars of April 2025 frost hours with a tick for a typical April. Sakarya 12 hours against about 2; Düzce 57 against about 12; inland Samsun 18 against 4; inland Ordu 45 against 21; inland Giresun 40 against 25; inland Trabzon 33 against 13.

Düzce had 57 frost hours: five times a typical April, and the most since 2000. Sakarya had its second-worst April. Further east, inland Samsun, Ordu, Giresun and Trabzon all had more frost than usual, but less than in April 2004. The coast had none.

Demeter connected
orchard.kmz
Which have been the best and worst performing areas of this orchard since it was planted?
Matched the boundary to an almond orchard near Beja: 74 ha, planted 2017
Ranked every part of the orchard against the rest, for each summer month since 2018
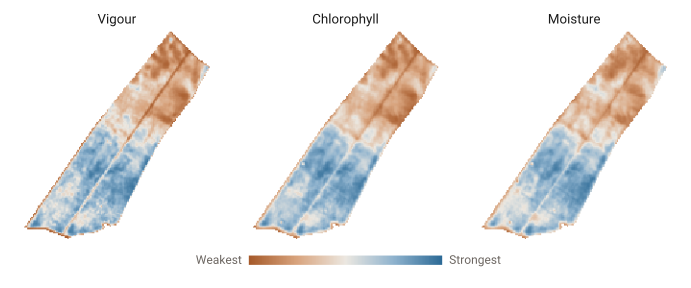
Three maps of the orchard for vigour, chlorophyll and moisture, each shaded from weakest (brown) to strongest (blue) against the rest of the orchard. The north-east half is brown in all three and the south-west blue.
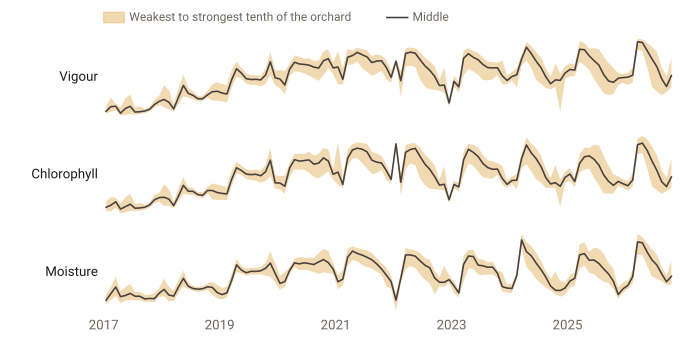
Monthly band from the weakest to the strongest tenth of the orchard, with the middle as a line, for vigour, chlorophyll and moisture from 2017 to 2026. The band widens in recent summers.

The north-east half has been the weakest ground since the first full season, and the south-west the strongest. The pattern has barely moved: maps of 2018–21 and 2022–26 look alike. The summer gap between the strongest and weakest tenth of the orchard has widened by three quarters since 2021.

Free

£0/ month

Try us out!

Climate

3 locations concurrently· 24 months

Fields

Headline statistics

Satellite

—

Comparisons

—

Extra

All indices · catalogue search

Tier 1

£30/ month

Single user

Climate and regional views.

Everything in Free, plus:

Climate

50 locations concurrently · 10 years

Fields

Counts, area and crop mix by region

Satellite

Regional crop condition over time

Comparisons

Regions side by side

Extra

Irrigation districts, PDOs, protected areas

Tier 2

£500/ month

Entire organisation

Local & subregional views

Everything in Tier 1, plus:

Climate

50 locations concurrently · since 2000

Fields

Planting year, size and more by area

Satellite

Field clusters

Comparisons

Peer groups

Extra

Single field look-up by point, APN or file

Tier 3

Talk to Demeter

Free trial with a Tier 2 account

Every field, every data point

Contact Demeter

Everything in Tier 2, plus:

Climate

Unlimited locations concurrently · since 2000

Fields

Individual field rankings

Satellite

Every field, incl. water use history

Comparisons

Fields vs custom peer groups

Extra

Automated reports · external collaborators

What is an MCP server?

MCP (Model Context Protocol) is an open standard that lets AI apps like Claude and ChatGPT use outside tools and data. Demeter's MCP server gives AI tools direct access to its data across domains and regions.

Which AI apps work with Demeter?

Any app that supports remote MCP servers, including Claude, ChatGPT, Codex, Gemini and Grok.

Do I need a Demeter account to connect?

Yes. When adding the MCP server, the AI app will require you to sign in to Demeter. If you do not already have an account, you will be able to create one. The data available through the MCP server is determined based on the plan you have selected.

How is access secured?

Sign-in is via OAuth, and your AI app will only be able to access the information in Demeter that corresponds to your plan.

Does Demeter see my data?

Demeter cannot see the session in your AI tool, your queries, any third-party data you put into your session or the outputs generated by your AI tool using Demeter’s data. The data requests made by your AI tool to Demeter’s servers are logged for quality control and product improvement purposes.

What can I ask?

Anything within Demeter’s coverage universe, including queries relating to screening, benchmarking, due diligence, crop landscape or climate trends. Available data includes Demeter's full climate and field-level satellite records, irrigation resources and cropping histories.