California stands at 94.8 in week 3, 5.0% lower than the last publication. Regional readings run from 94.4 in Southern San Joaquin to 95.1 in Sacramento Valley. Among the larger counties, Sutter, Stanislaus and Yolo were 5.4 to 5.6% lower.
The 2026/27 crop, now being marketed, is forecast at 2.694 billion pounds (range 2.602 to 2.785), 0.8% below the 2.715 billion pounds USDA NASS recorded for 2025. By the August report, 22.1% of the expected crop was shipped or committed, against a median of 26.3% and a range of 21.9% to 37.8% since 2000. Shipments are running at the normal pace for a crop this size, though 21% above the same point last year. The forecast is set out in full in the 2026 California almond forecast.
Headline publication is fortnightly except during the bloom period, when it is weekly.
# Composite regions - Week 3
| Region | Week 2 (stub) | Week 3 | % change |
|---|---|---|---|
| Sacramento Valley | 100.0 | 95.1 | −4.9% |
| Northern San Joaquin | 100.4 | 95.0 | −5.3% |
| Southern San Joaquin | 99.1 | 94.4 | −4.8% |
| All California | 99.7 | 94.8 | −5.0% |
Baseline: 2000-2025 mean = 100.0, before frost and chill penalties
# County-level breakdown - Week 3
| County | Week 2 (stub) | Week 3 | % change |
|---|---|---|---|
| Riverside | 96.1 | 105.1 | +9.4% |
| Contra Costa | 101.0 | 96.5 | −4.5% |
| Alameda | 100.9 | 96.4 | −4.5% |
| San Diego | 100.0 | 96.3 | −3.8% |
| San Luis Obispo | 100.6 | 96.2 | −4.4% |
| Solano | 101.3 | 96.2 | −5.1% |
| Sacramento | 101.1 | 95.5 | −5.6% |
| Lake | 99.2 | 95.4 | −3.8% |
| San Joaquin | 100.8 | 95.4 | −5.3% |
| Yolo | 100.8 | 95.4 | −5.4% |
| Merced | 100.3 | 95.2 | −5.0% |
| Glenn | 99.5 | 95.2 | −4.4% |
| Tulare | 99.1 | 95.1 | −4.0% |
| Butte | 99.5 | 94.9 | −4.6% |
| Colusa | 99.9 | 94.8 | −5.1% |
| Calaveras | 100.7 | 94.8 | −5.8% |
| Tehama | 99.0 | 94.8 | −4.2% |
| Kings | 99.0 | 94.8 | −4.3% |
| Shasta | 98.1 | 94.7 | −3.5% |
| Sutter | 100.3 | 94.7 | −5.6% |
| Placer | 100.5 | 94.7 | −5.8% |
| Stanislaus | 100.2 | 94.7 | −5.5% |
| Yuba | 100.2 | 94.6 | −5.6% |
| Kern | 98.8 | 94.4 | −4.4% |
| Fresno | 99.2 | 94.3 | −5.0% |
| Madera | 99.5 | 94.1 | −5.4% |
| Santa Barbara | 97.7 | 93.0 | −4.8% |
# Elsewhere
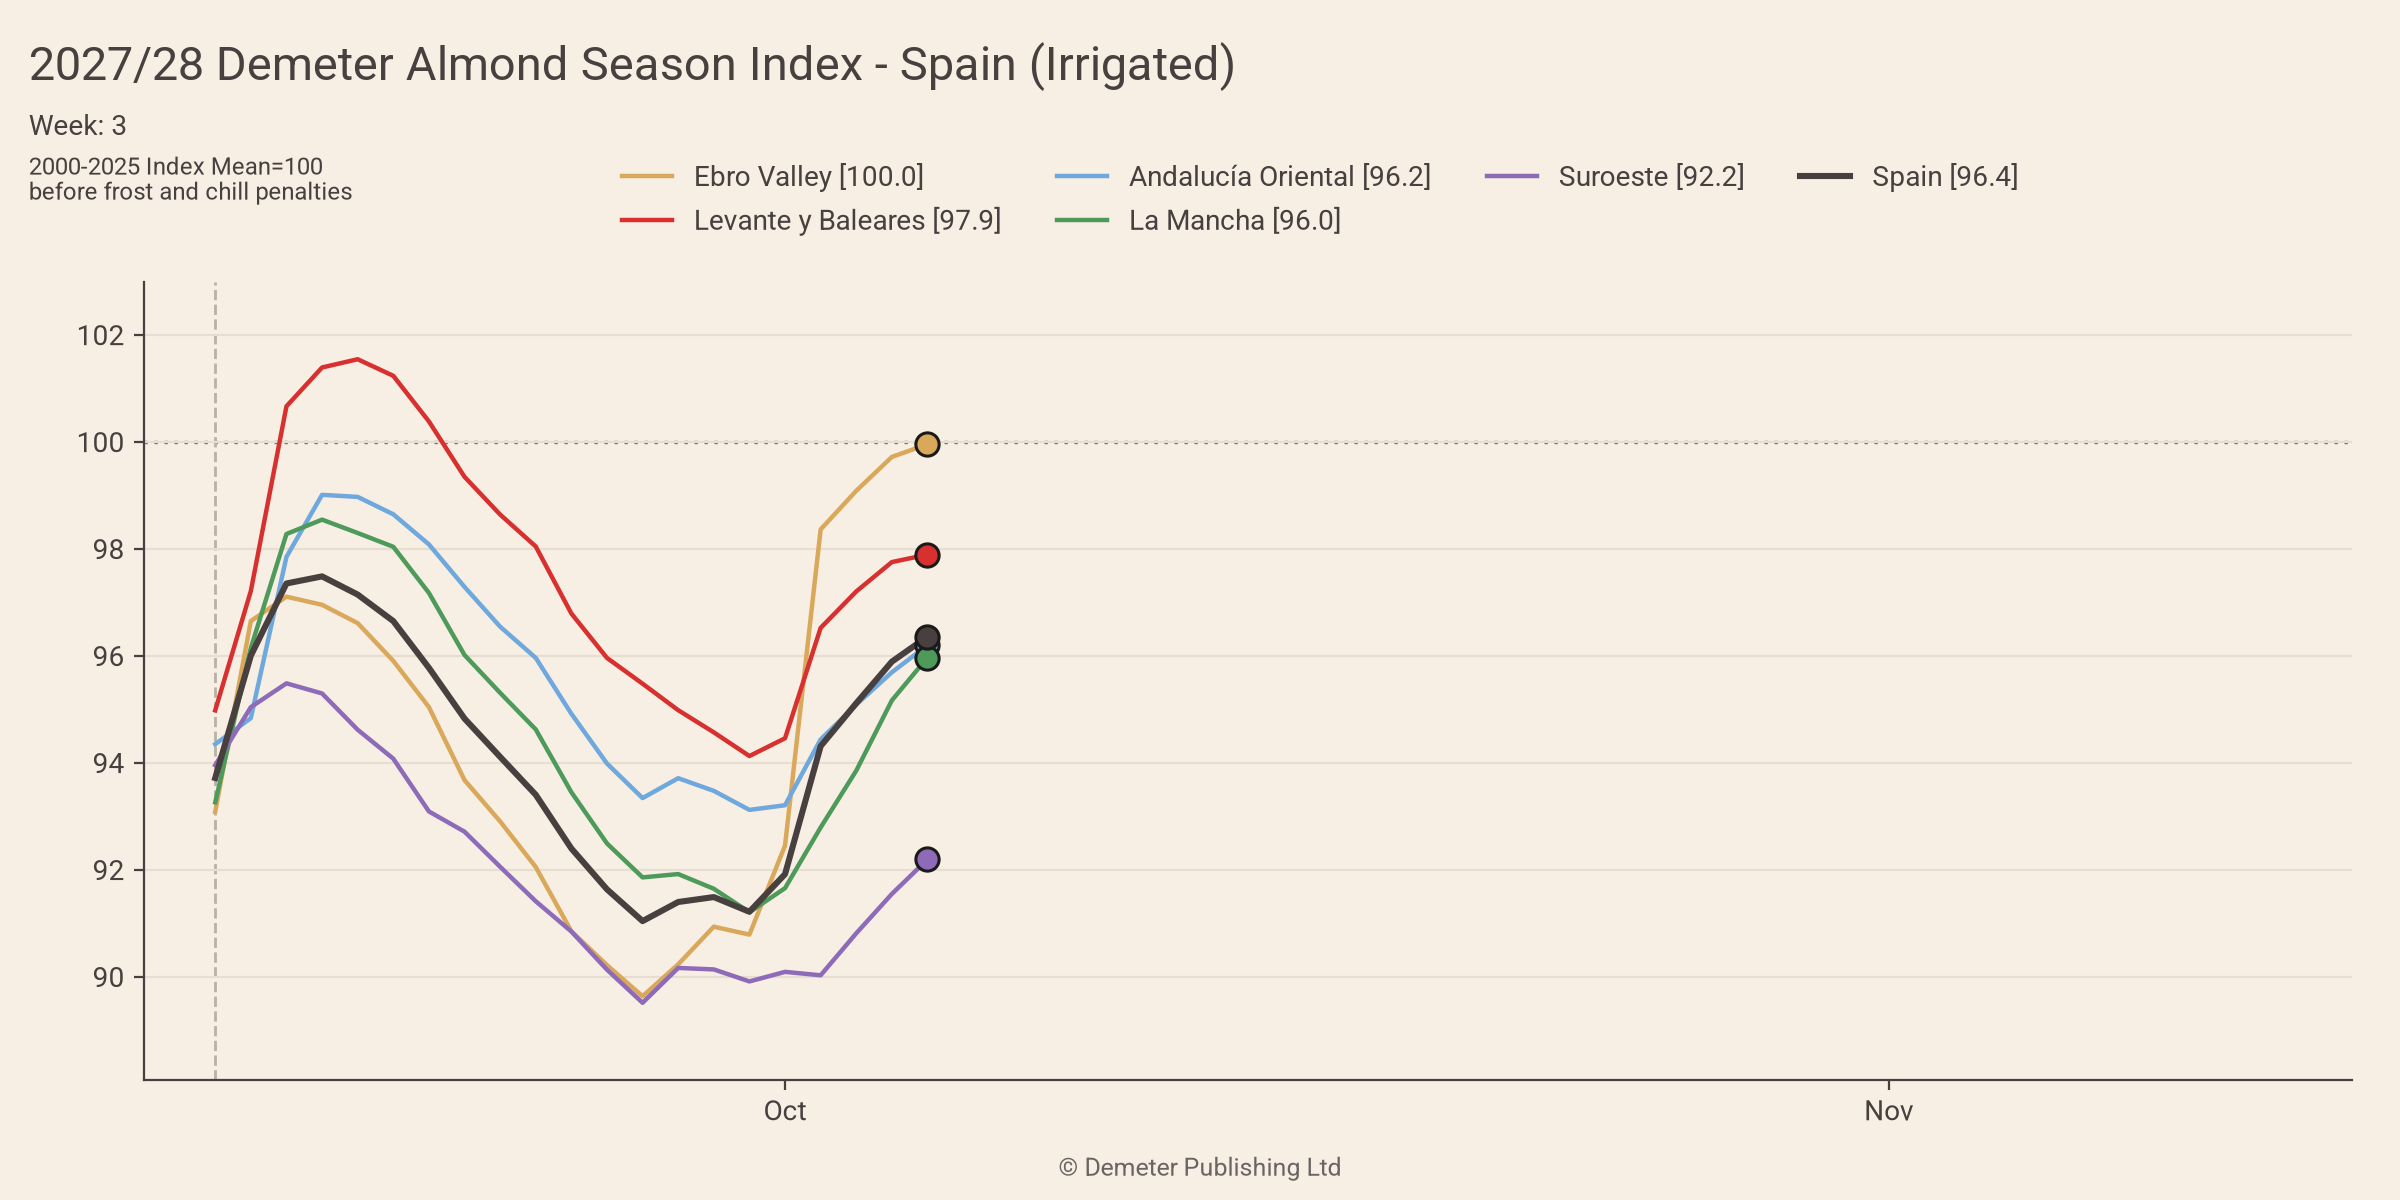
Spain stands at 96.4 in week 3. The 2026/27 crop is forecast at 172.1 kt of kernel, 26% above 2025.
Portugal stands at 92.9 in week 3. The 2026/27 crop is forecast at 34.5 kt of kernel, 39% above 2025.
The Spain and Portugal forecasts are set out in full in the Spain almond production forecast 2026/27 and Portugal almond production forecast 2026/27.
Sales figures from the Almond Board of California position report for August, published 2026-09-12.
# Data and further reading
Published on Mondays at 12:00 London — fortnightly, and weekly across bloom.
Next publication: 26 October 2026.
Subscribe to receive headline index publications by email here.