# Spain
Spain stands at 96.4 in week 3, 1.6% higher than the last publication. Regional readings run from 92.2 in Suroeste to 100.0 in Ebro Valley.
The 2026/27 crop, now being marketed, is forecast at 172.1 kt of kernel (range 157.1 to 187.0), 26% above the 136.6 kt of kernel MAPA recorded for 2025. The forecast is set out in full in the Spain almond production forecast 2026/27, with the method and track record alongside it.
Headline publication is fortnightly except during the bloom period, when it is weekly.
# Regions - Week 3
| Region | Week 2 (stub) | Week 3 | % change |
|---|---|---|---|
| Ebro Valley | 93.7 | 100.0 | +6.7% |
| Levante y Baleares | 99.3 | 97.9 | −1.5% |
| Andalucía Oriental | 97.3 | 96.2 | −1.1% |
| La Mancha | 96.0 | 96.0 | −0.0% |
| Suroeste | 92.7 | 92.2 | −0.6% |
| All Spain | 94.8 | 96.4 | +1.6% |
Baseline: 2000-2025 mean = 100.0, before frost and chill penalties
# Autonomous communities - Week 3
| Autonomous community | Week 2 (stub) | Week 3 | % change |
|---|---|---|---|
| Cataluña | 92.9 | 103.1 | +10.9% |
| Aragón | 93.8 | 99.2 | +5.7% |
| Región de Murcia | 101.5 | 98.6 | −2.8% |
| Comunidad Valenciana | 98.1 | 97.9 | −0.2% |
| País Vasco | 97.9 | 97.5 | −0.4% |
| Comunidad de Madrid | 96.2 | 96.9 | +0.8% |
| Castilla-La Mancha | 96.0 | 96.0 | −0.1% |
| La Rioja | 95.8 | 95.1 | −0.7% |
| Castilla y León | 94.4 | 94.4 | −0.1% |
| Comunidad Foral de Navarra | 95.7 | 94.3 | −1.5% |
| Extremadura | 92.1 | 94.1 | +2.2% |
| Andalucía | 94.5 | 92.6 | −2.0% |
| Islas Baleares | 97.1 | 92.1 | −5.2% |
Province-level data is available via the Demeter platform and MCP.
# Portugal
Portugal stands at 92.9 in week 3, little changed from the last publication. Regional readings run from 92.8 in Alentejo to 93.6 in Beira Interior.
The 2026/27 crop, now being marketed, is forecast at 34.5 kt of kernel (range 30.9 to 38.1), 39% above the 24.8 kt of kernel INE recorded for 2025. The forecast is set out in full in the Portugal almond production forecast 2026/27, with the method and track record alongside it.
# Regions - Week 3
| Region | Week 2 (stub) | Week 3 | % change |
|---|---|---|---|
| Beira Interior | 93.5 | 93.6 | +0.1% |
| Trás-os-Montes | 93.8 | 93.0 | −0.9% |
| Ribatejo e Oeste | 92.5 | 92.9 | +0.5% |
| Alentejo | 92.8 | 92.8 | +0.1% |
| All Portugal | 92.9 | 92.9 | +0.0% |
Baseline: 2000-2025 mean = 100.0, before frost and chill penalties
# Districts - Week 3
| District | Week 2 (stub) | Week 3 | % change |
|---|---|---|---|
| Coimbra | 93.7 | 94.3 | +0.6% |
| Guarda | 93.4 | 94.1 | +0.8% |
| Portalegre | 93.2 | 94.1 | +1.0% |
| Castelo Branco | 93.5 | 93.6 | +0.1% |
| Braga | 93.7 | 93.5 | −0.2% |
| Évora | 92.9 | 93.1 | +0.2% |
| Vila Real | 94.2 | 93.0 | −1.2% |
| Bragança | 93.8 | 93.0 | −0.9% |
| Santarém | 92.5 | 92.9 | +0.5% |
| Faro | 93.0 | 92.8 | −0.1% |
| Beja | 92.7 | 92.7 | +0.1% |
| Viseu | 93.1 | 92.5 | −0.6% |
| Setúbal | 92.5 | 92.0 | −0.5% |
Municipality-level data is available via the Demeter platform and MCP.
# Elsewhere
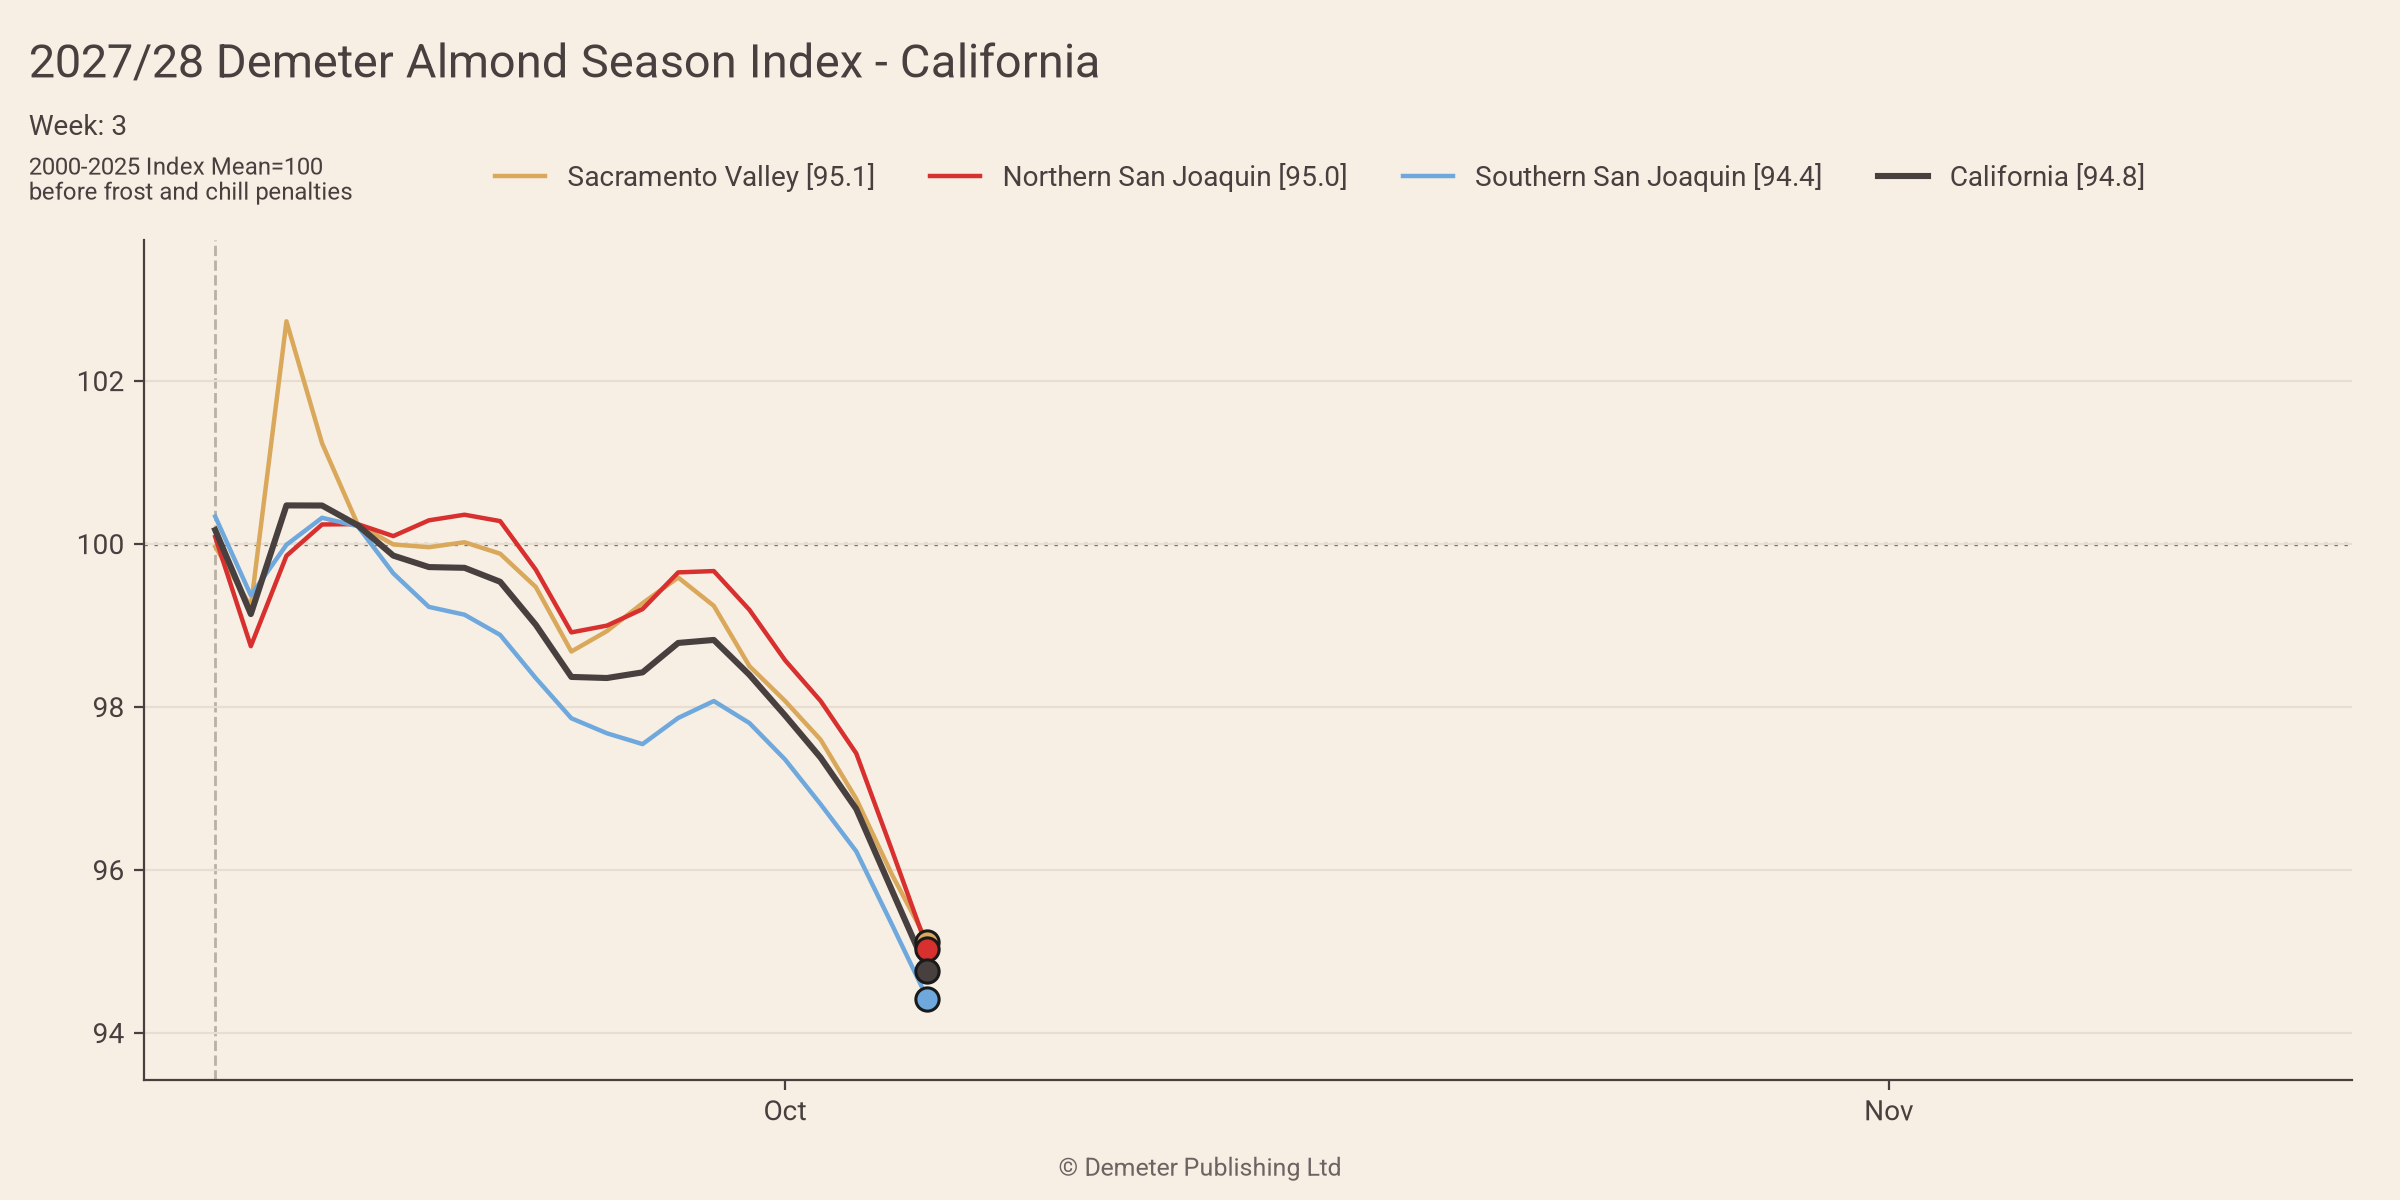
California stands at 94.8 in week 3. The 2026/27 crop is forecast at 2.694 billion pounds, 0.8% below 2025. By the August report, 22.1% of the expected crop was shipped or committed, against a median of 26.3% and a range of 21.9% to 37.8% since 2000. Shipments are running at the normal pace for a crop this size, though 21% above the same point last year.
The California forecast is set out in full in the 2026 California almond forecast.
# Data and further reading
Published on Mondays at 12:00 London — fortnightly, and weekly across bloom.
Next publication: 26 October 2026.
Subscribe to receive headline index publications by email here.