Reference data across the agriculture value chain
Benchmark against 24,900,000+ operations
Compare assets and assemble peer groups from Demeter's global database.
Access the global database →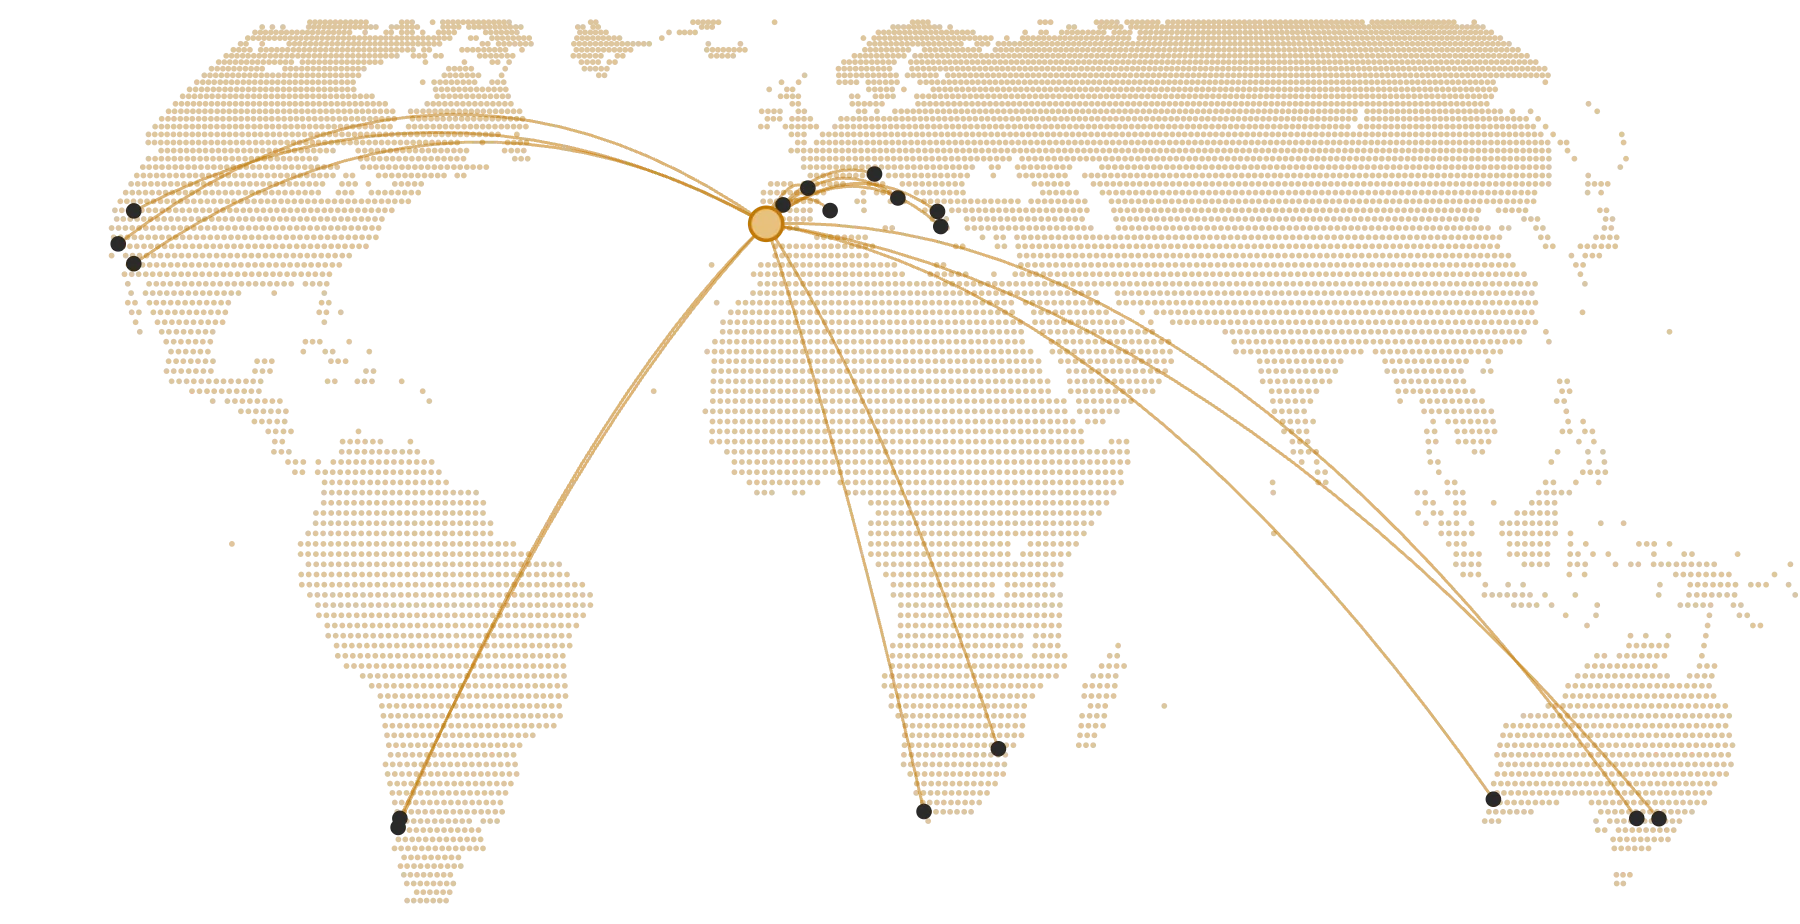
Field due diligence reports
Create and download a comprehensive field report in under 5 minutes
Create a field report →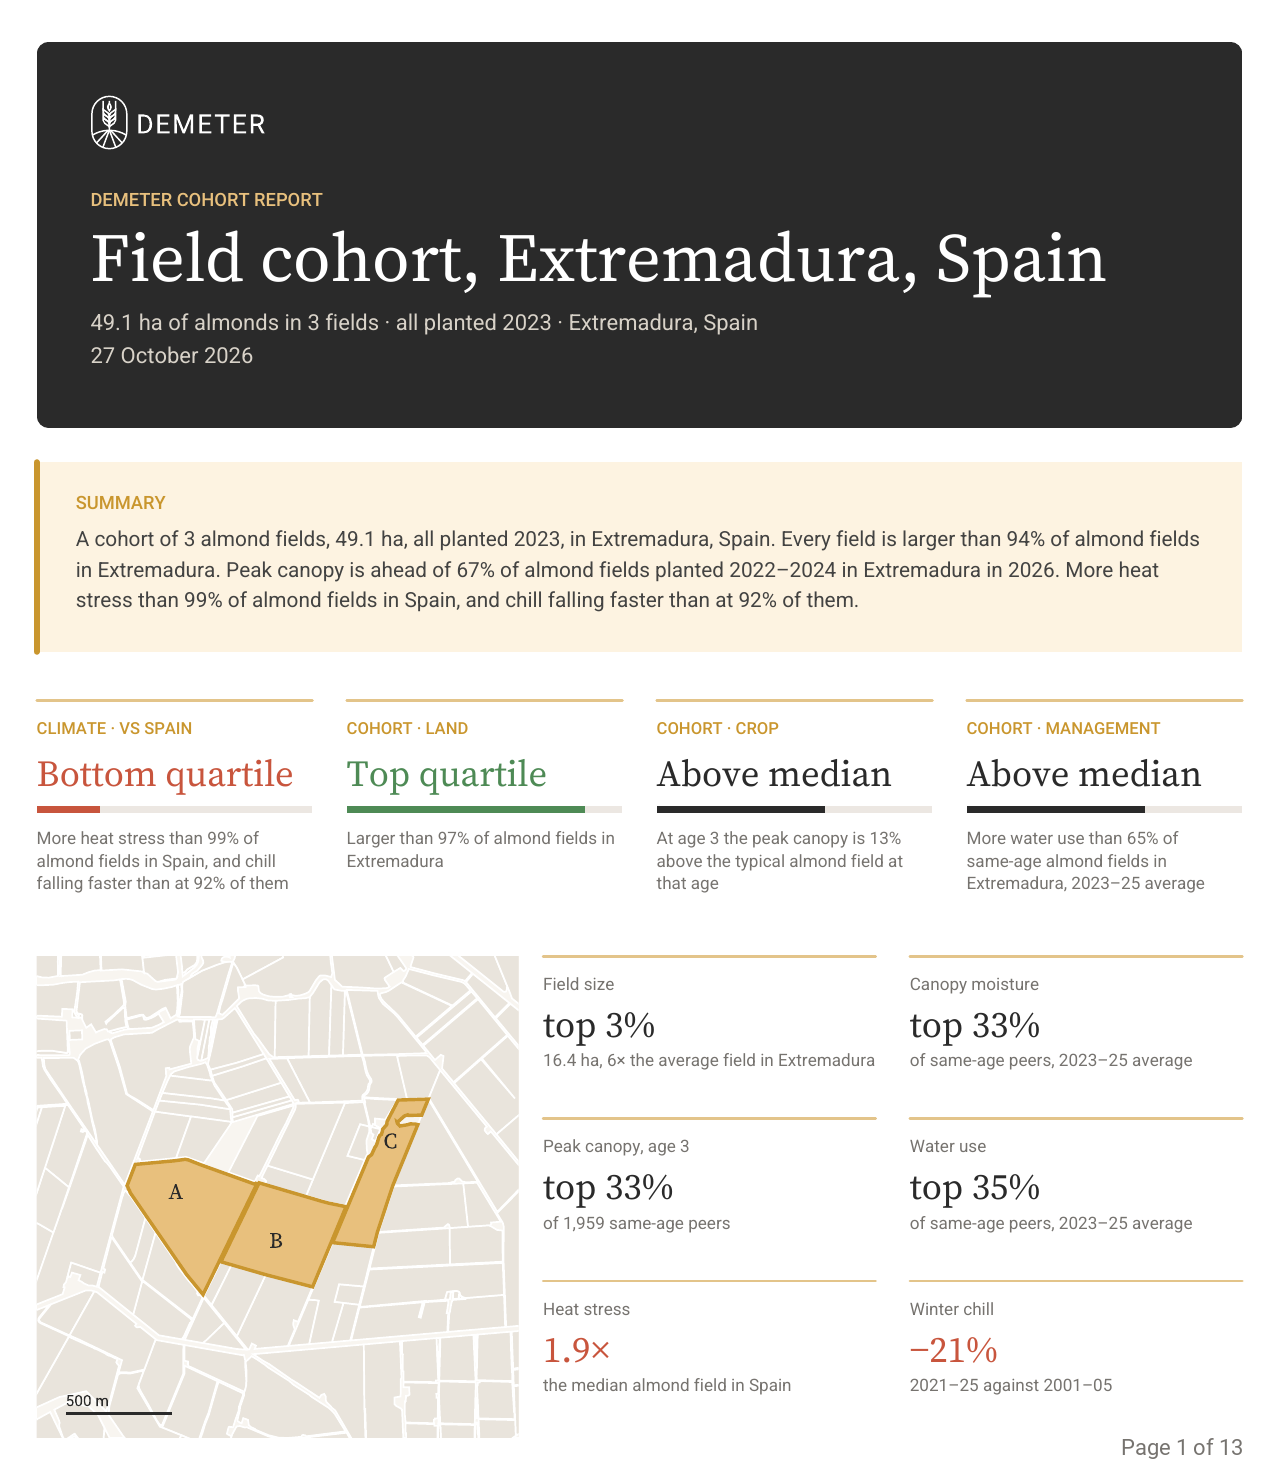
24,903,065
fields in global database
73.07 TB
of data
54.9B
satellite datapoints
27,560
datasets
Field-level agricultural data
Fields are the basic unit of agriculture.
Demeter’s coverage is defined in fields. This granularity ensures consistent depth and quality of data from single-field analysis up to work on whole value chains.
Explore the fields database →Crop value chain analysis
Agriculture has always been a black box, reliant on samples, surveys and censuses.
Demeter’s field-up coverage gives a comprehensive picture of whole crop value chains and regions, and clarity in minutes instead of months.
View data coverage →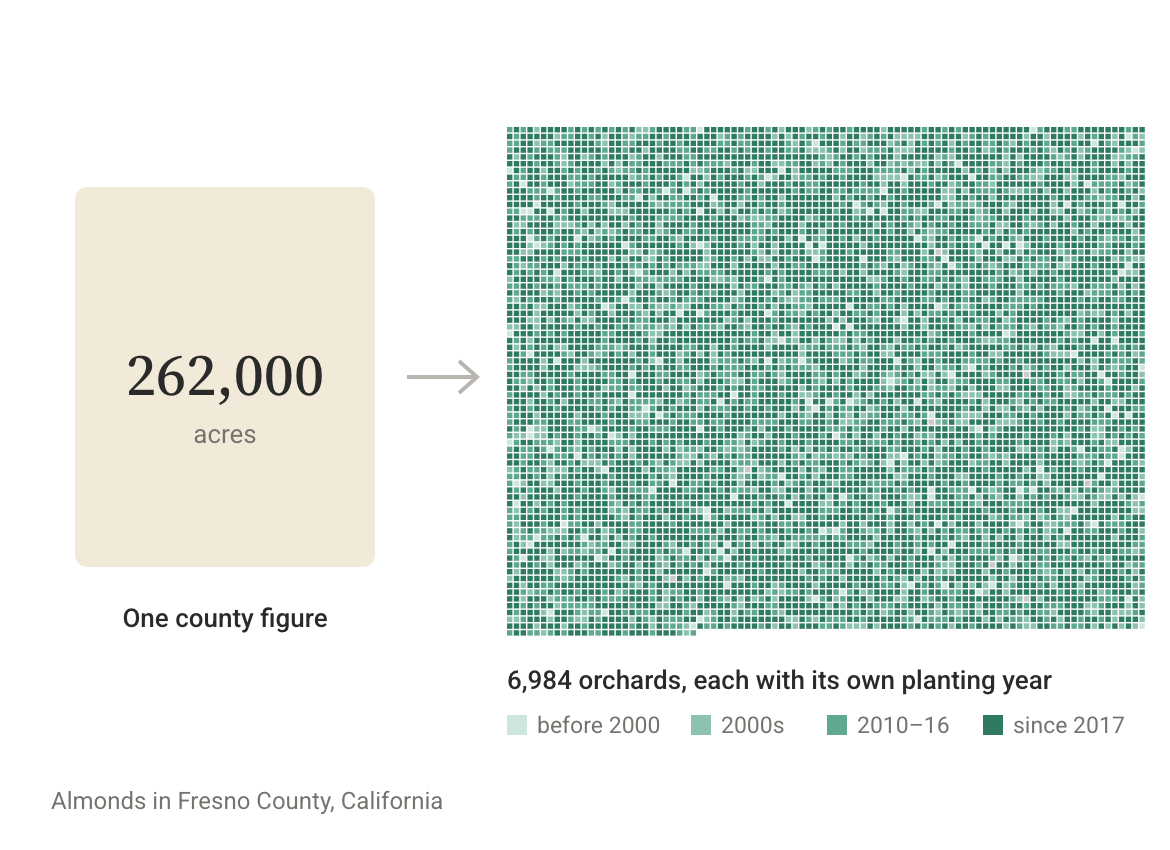
Farmland benchmarking
There is nowhere for a field to hide, and that makes comparisons powerful and possible at scale.
By comparing each field to its peers across Demeter’s suite of metrics, weather factors can be isolated from irrigation availability, topography from age, management practices from crop varieties. Quality becomes quantifiable when all fields are reviewed at once.
Benchmark against the fields database →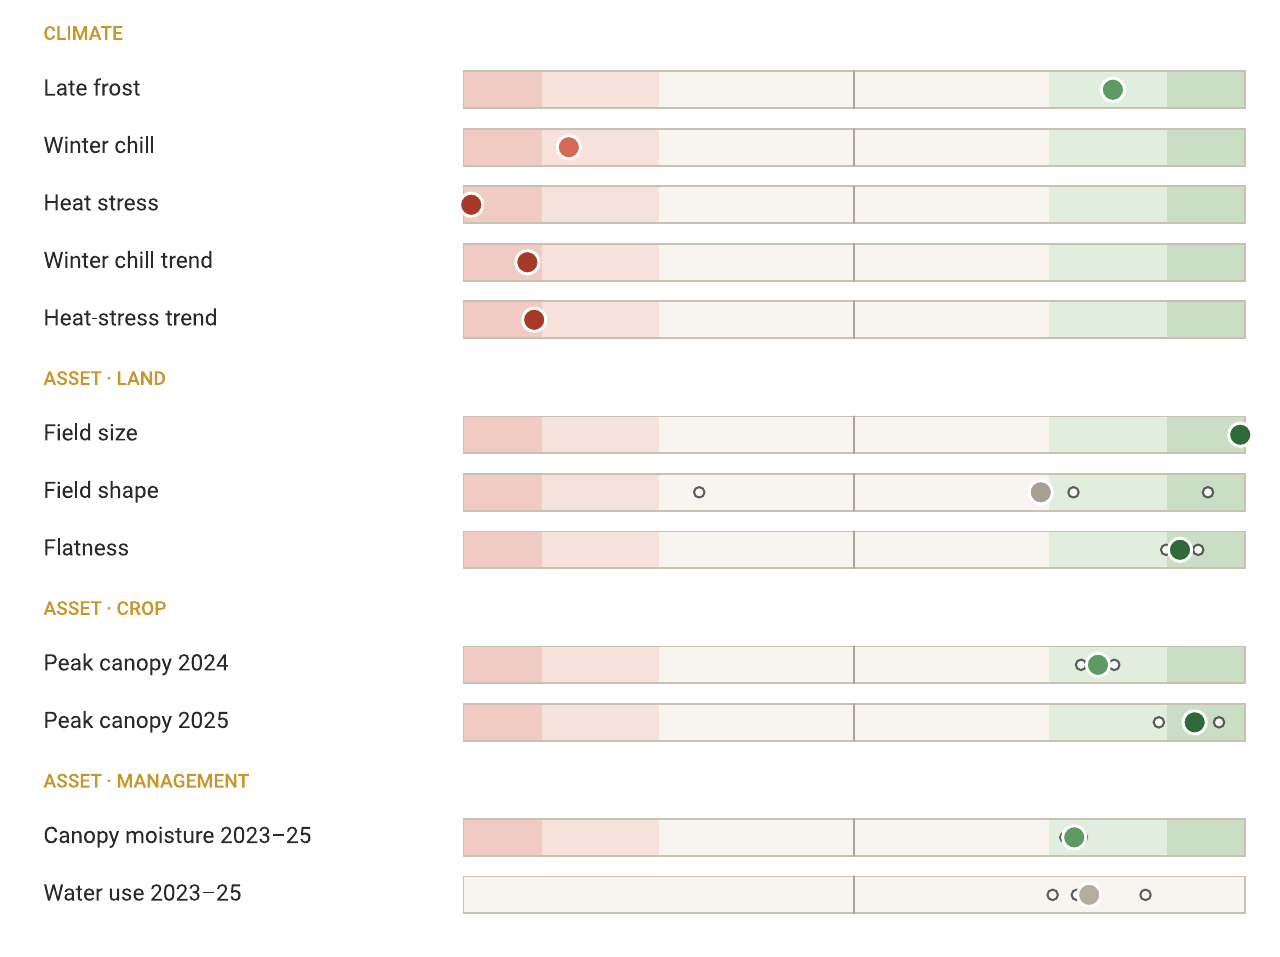
Crop production forecasts
The most useful aggregates are built bottom up.
Any crop or region-level aggregate built on Demeter data holds the full underlying field-level data. Analysing factors across an entire industry becomes as easy as identifying them for a single field.
View the almond crop forecasts →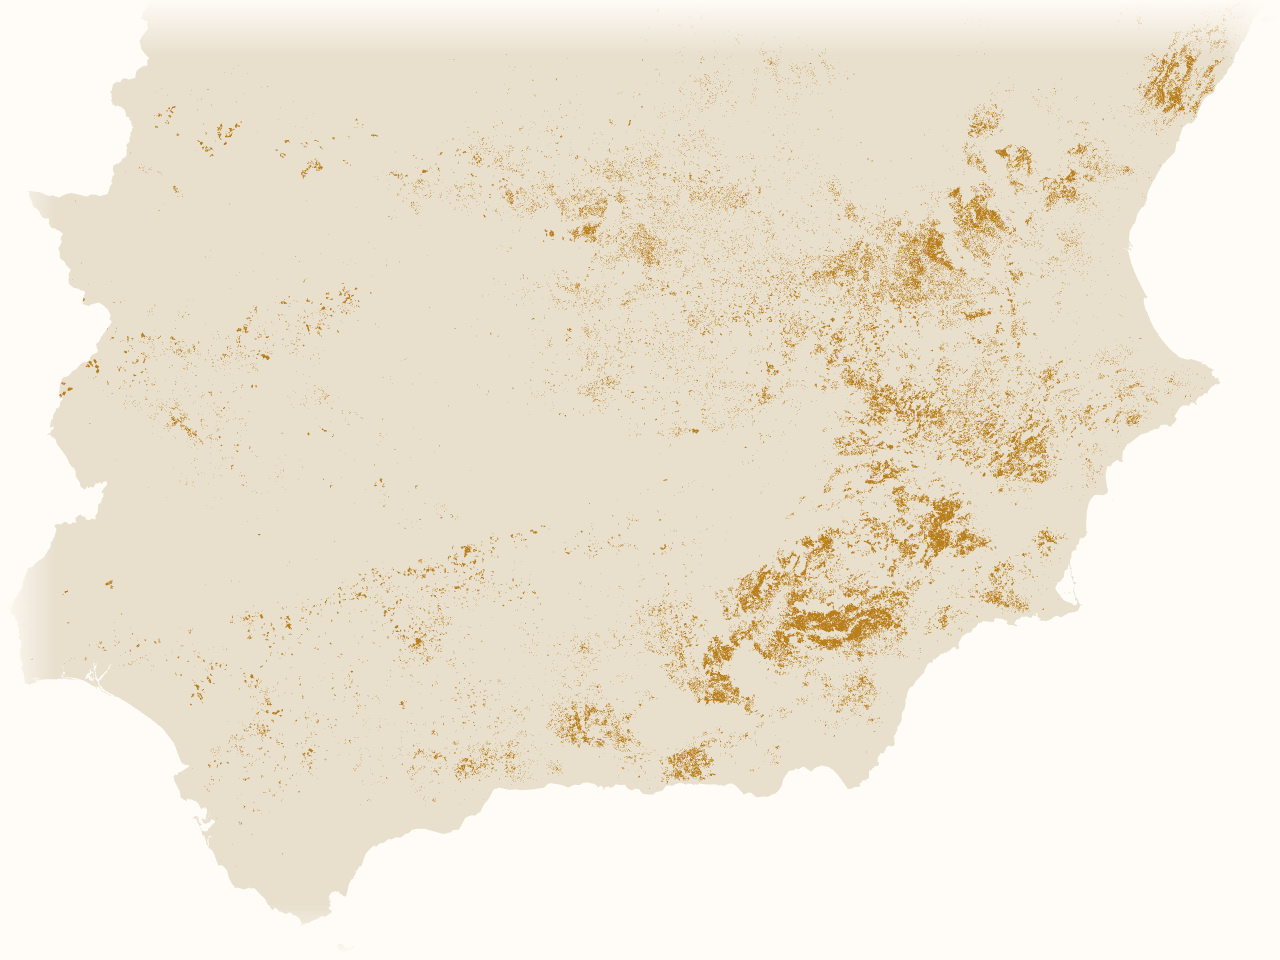
Global crop mapping
Demeter works by identifying all fields in a target region, and saying as much about each field as possible.
More becomes possible all the time - from cropping history and climate, to irrigation practices and reliability, to ease of operation and regulatory overlays.
View global coverage →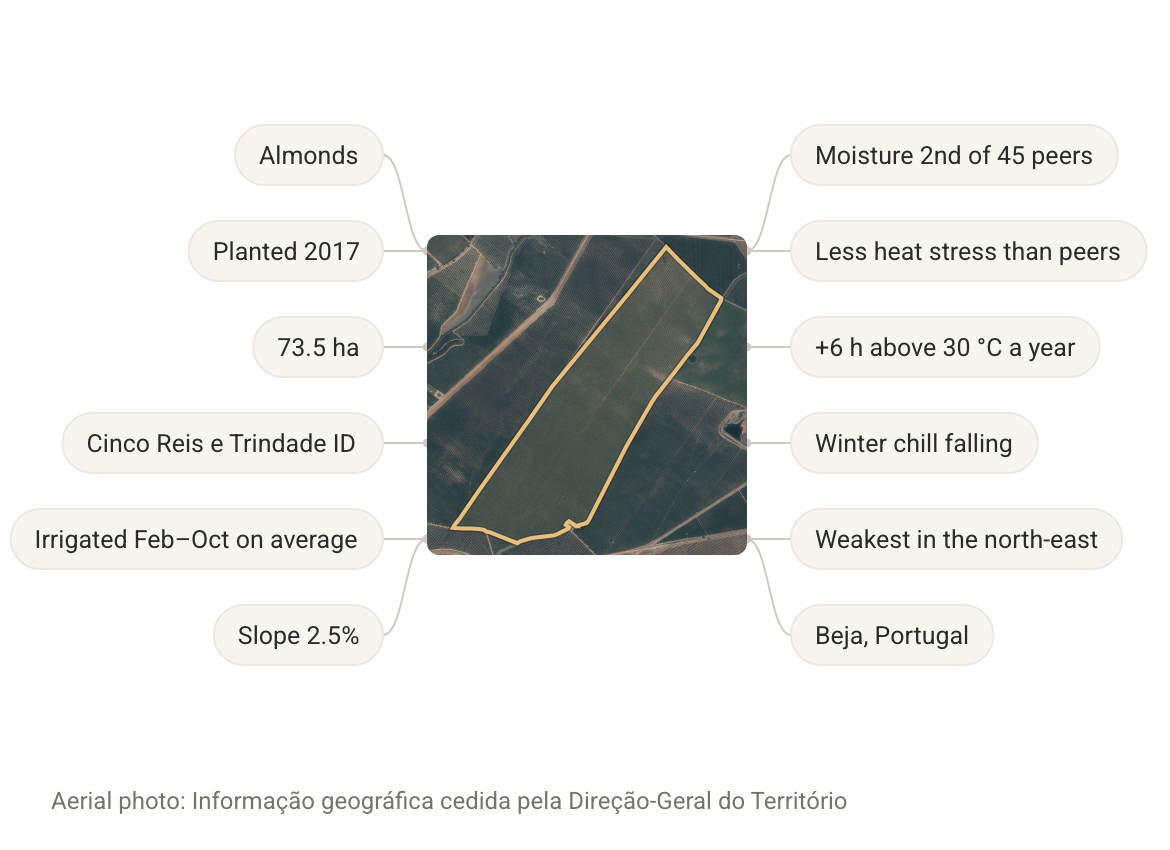
Crop health and water use monitoring
The operator knows the field best; Demeter's field-level data supplements this knowledge to provide a complete picture.
Identify the best and most stressed areas of the field, see if they have changed over time, observe differences in water consumption, and analyse whether performance is becoming more or less evenly distributed.
View plans and pricing →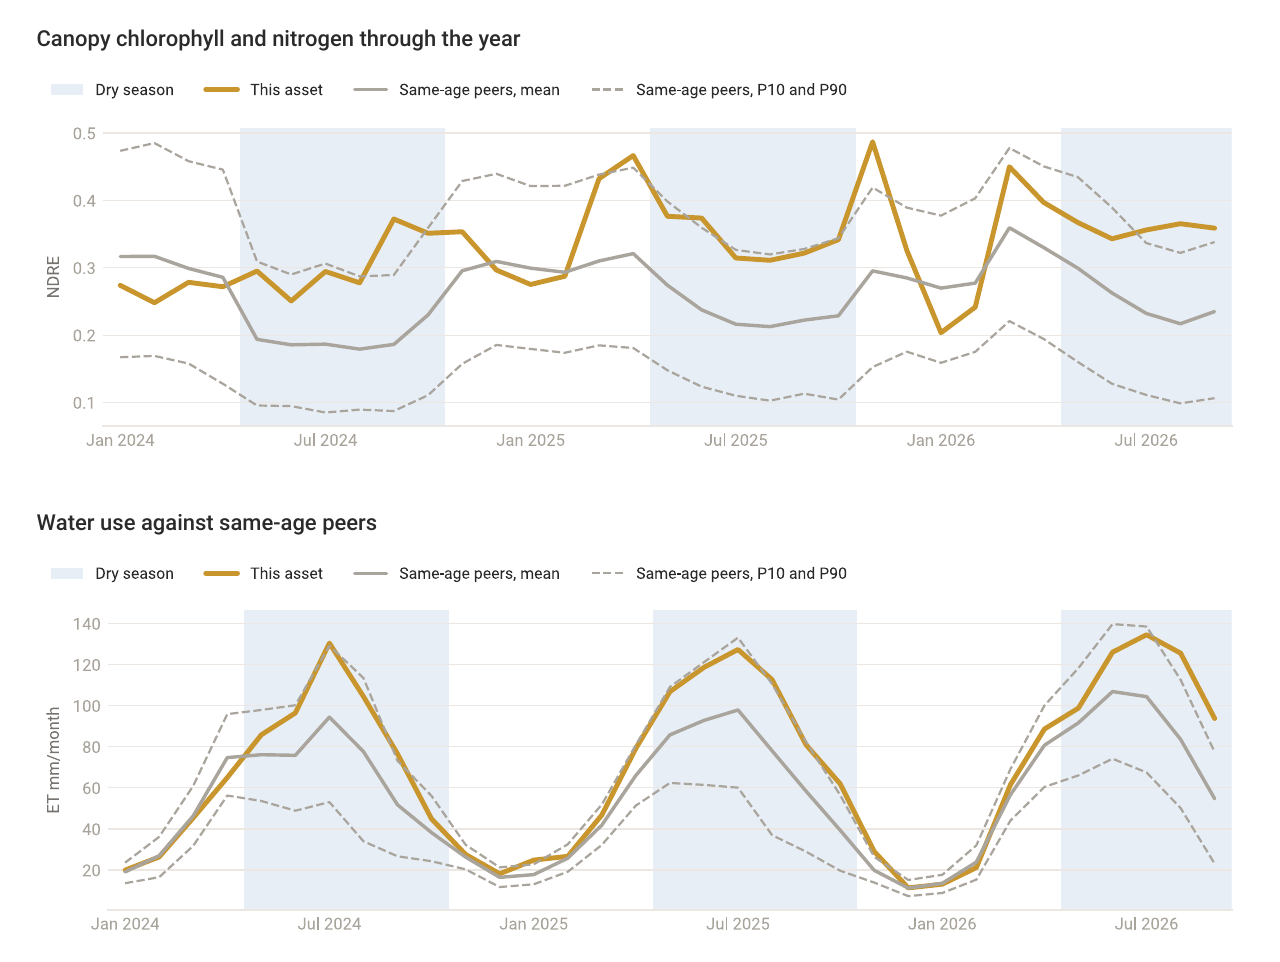
Agricultural climate risk data
Comparing climate conditions requires them to be measured the same way everywhere.
Demeter's climate coverage is global and standardised, and translated into factors that drive crop development - frost events, heat stress, chill accumulation, bloom rain - over more than 25 years. Any season can be set against its own history or any other region. Demeter's Growing Season Indices condense this into a single figure per crop and region, published daily and available to hedge through risk partners.
View the growing season indices →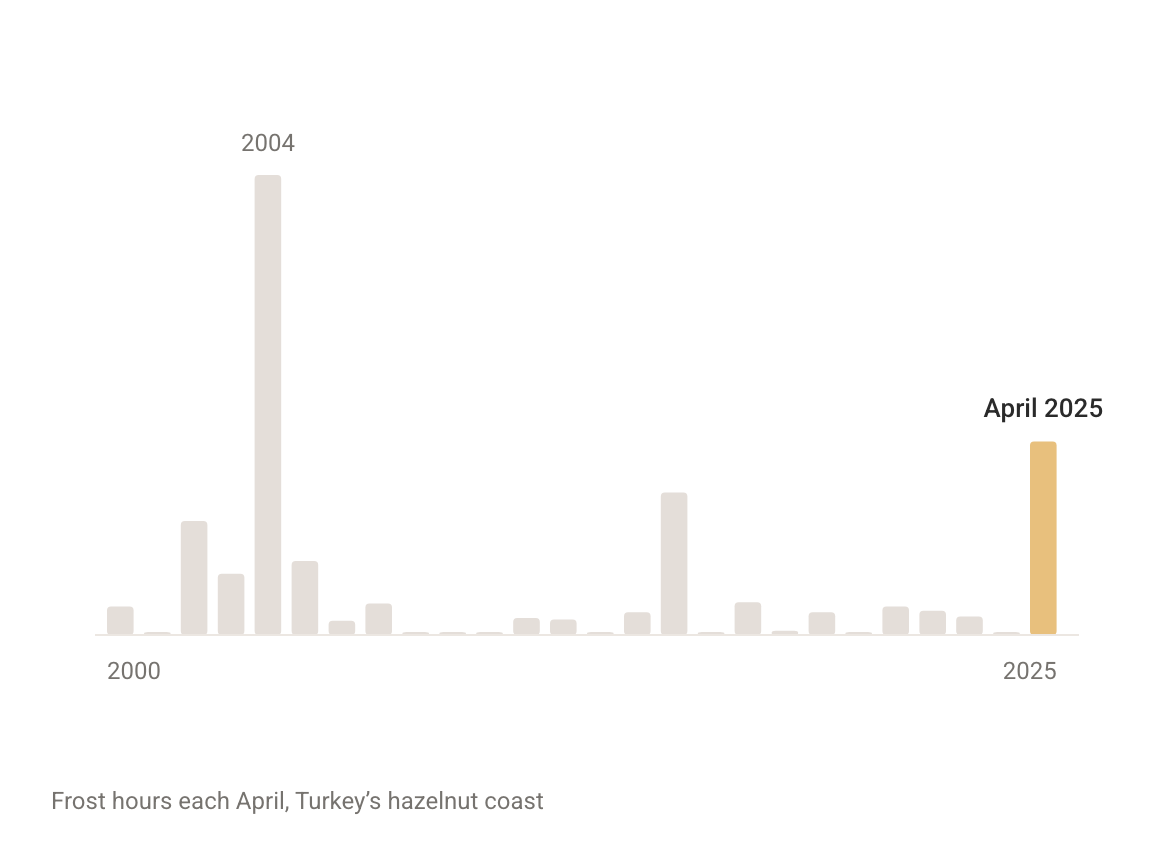
Farmland comparison
Every field Demeter covers is searchable.
Any combination of Demeter's metrics - crop, age and size, performance against peers, exposure to frost or heat, reliability of water supply - can be used to find matching fields, from peers in a single valley to Demeter's entire coverage universe. Find the strongest assets in a region, under-performers in the best locations, or new areas whose conditions match those where a crop already does well.
Find comparable farmland →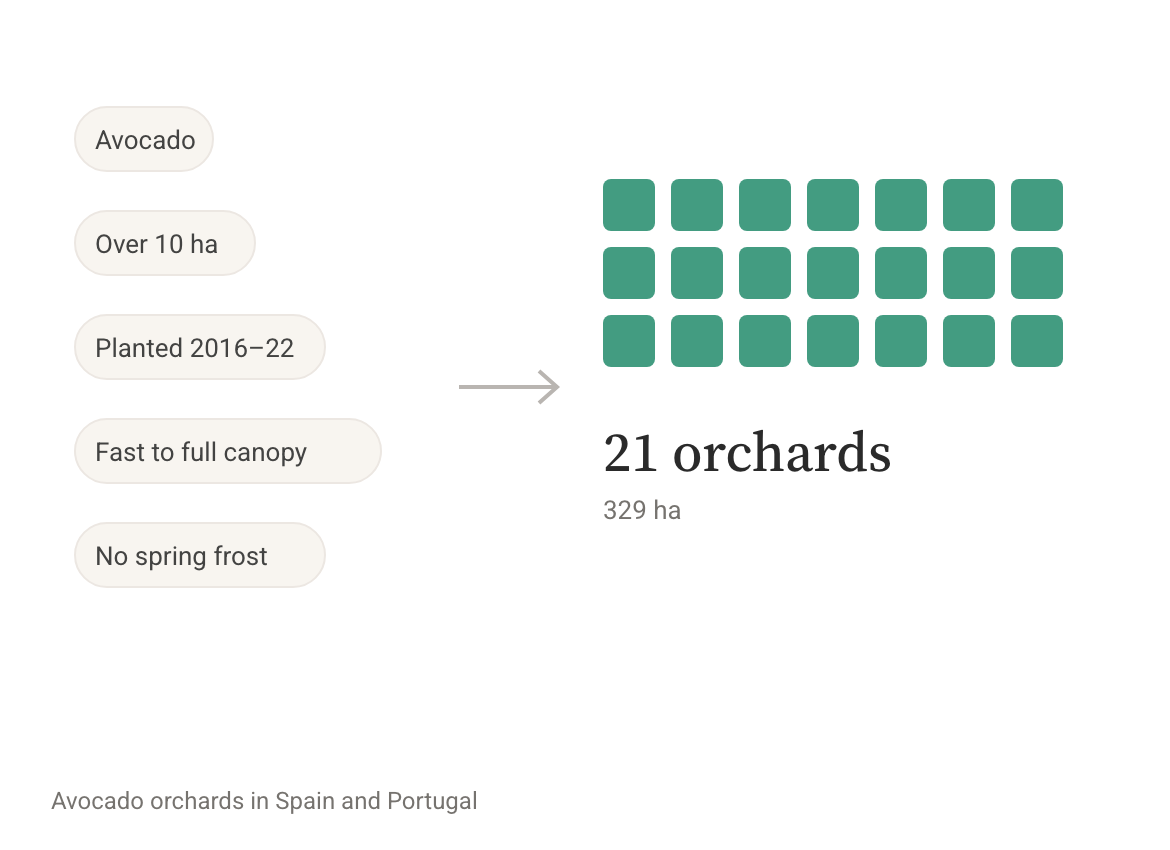
Agriculture investment analysis
Demeter supports important decisions in a sector that does not leave room for iteration.
When an iteration means a year, testing every decision against the full history of every comparable asset gives orders of magnitude more data to go on than the seasons experienced by the operator of a single asset.
Talk to us →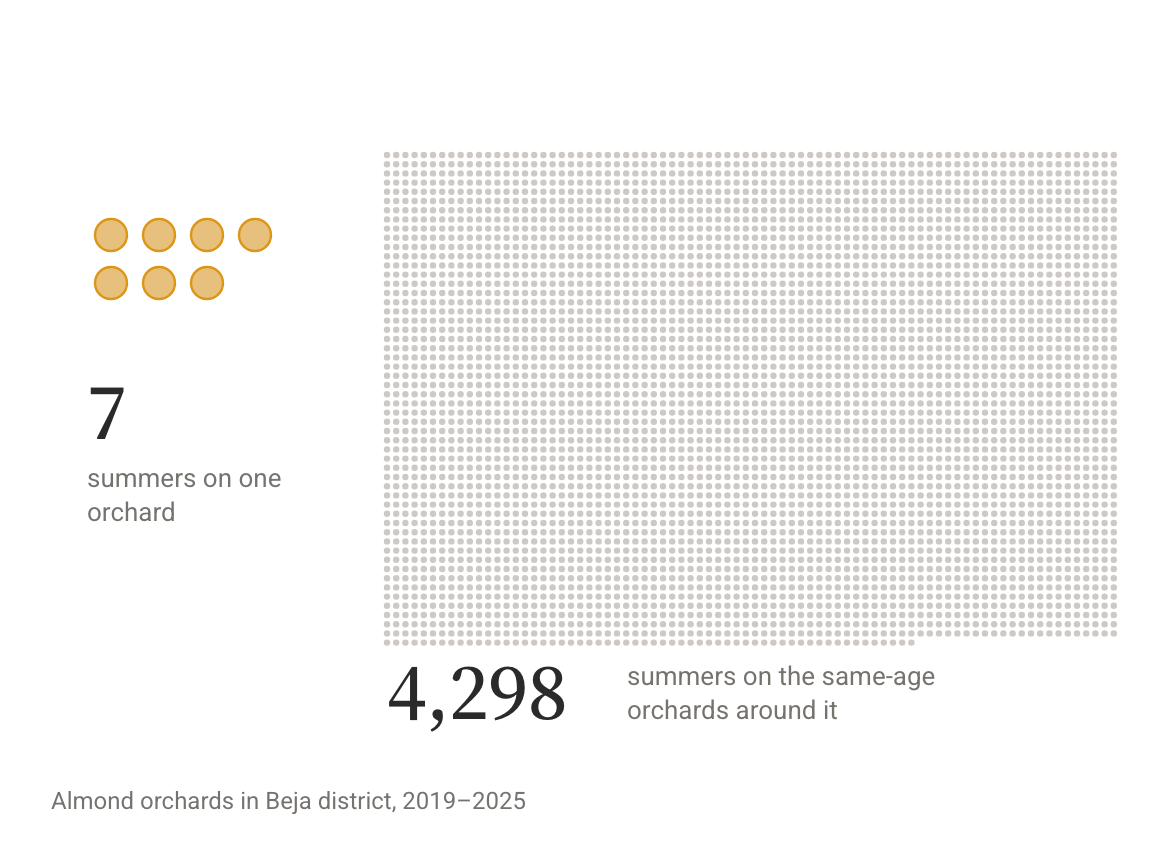
Agriculture data in Claude and ChatGPT
Demeter's data is available wherever analysis happens.
Connect Claude, ChatGPT and other AI tools in two clicks and ask questions in natural language, integrated with existing workflows and other data sources. Explore the data visually in Demeter's platform. Download it directly for use in any other system. It is free to try, and the Growing Season Indices, forecasts and research are always free.
Connect your AI tools →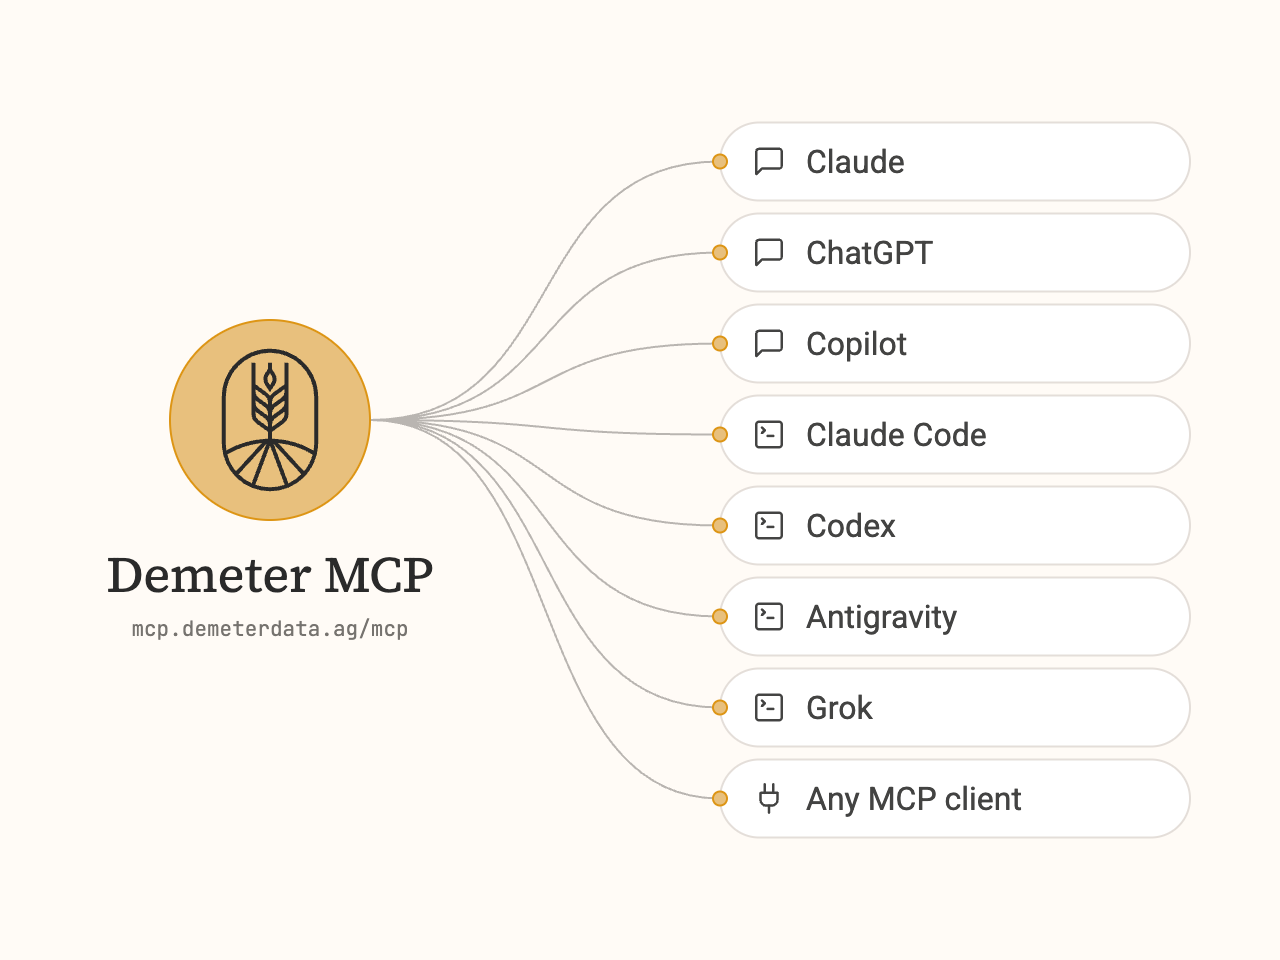
Open data library
Open agricultural data, free to download.
Demeter's open data library publishes global datasets on climate, rainfall, frost risk, winter chill, growing degree days, soils and more, derived from public sources and standardised for comparison by country and region. Explore any location on the map, or download the data free of charge.
Browse the open data library →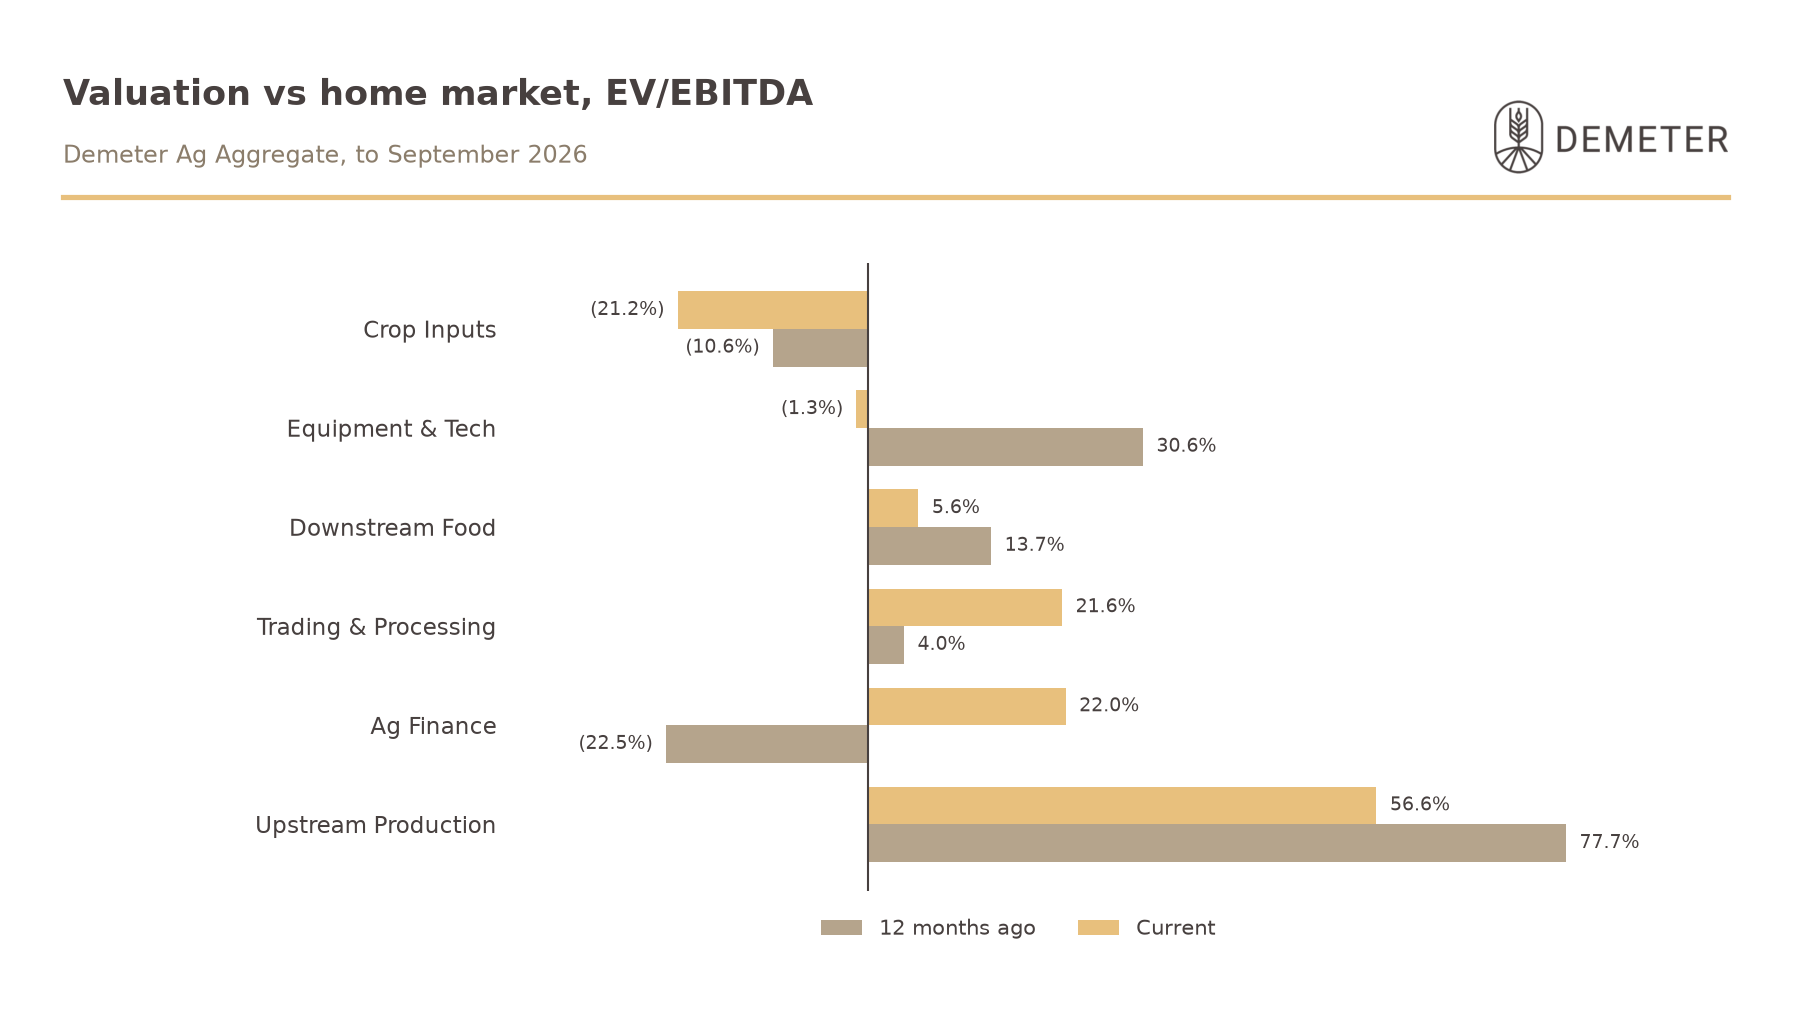
Demeter Ag Aggregate
Demeter Ag Aggregate: valuation bulletin, October 2026
How the six sub-sectors of the Demeter Ag Aggregate are valued against the broad market in their own countries, on an EV/EBITDA basis.
Almond Season Index
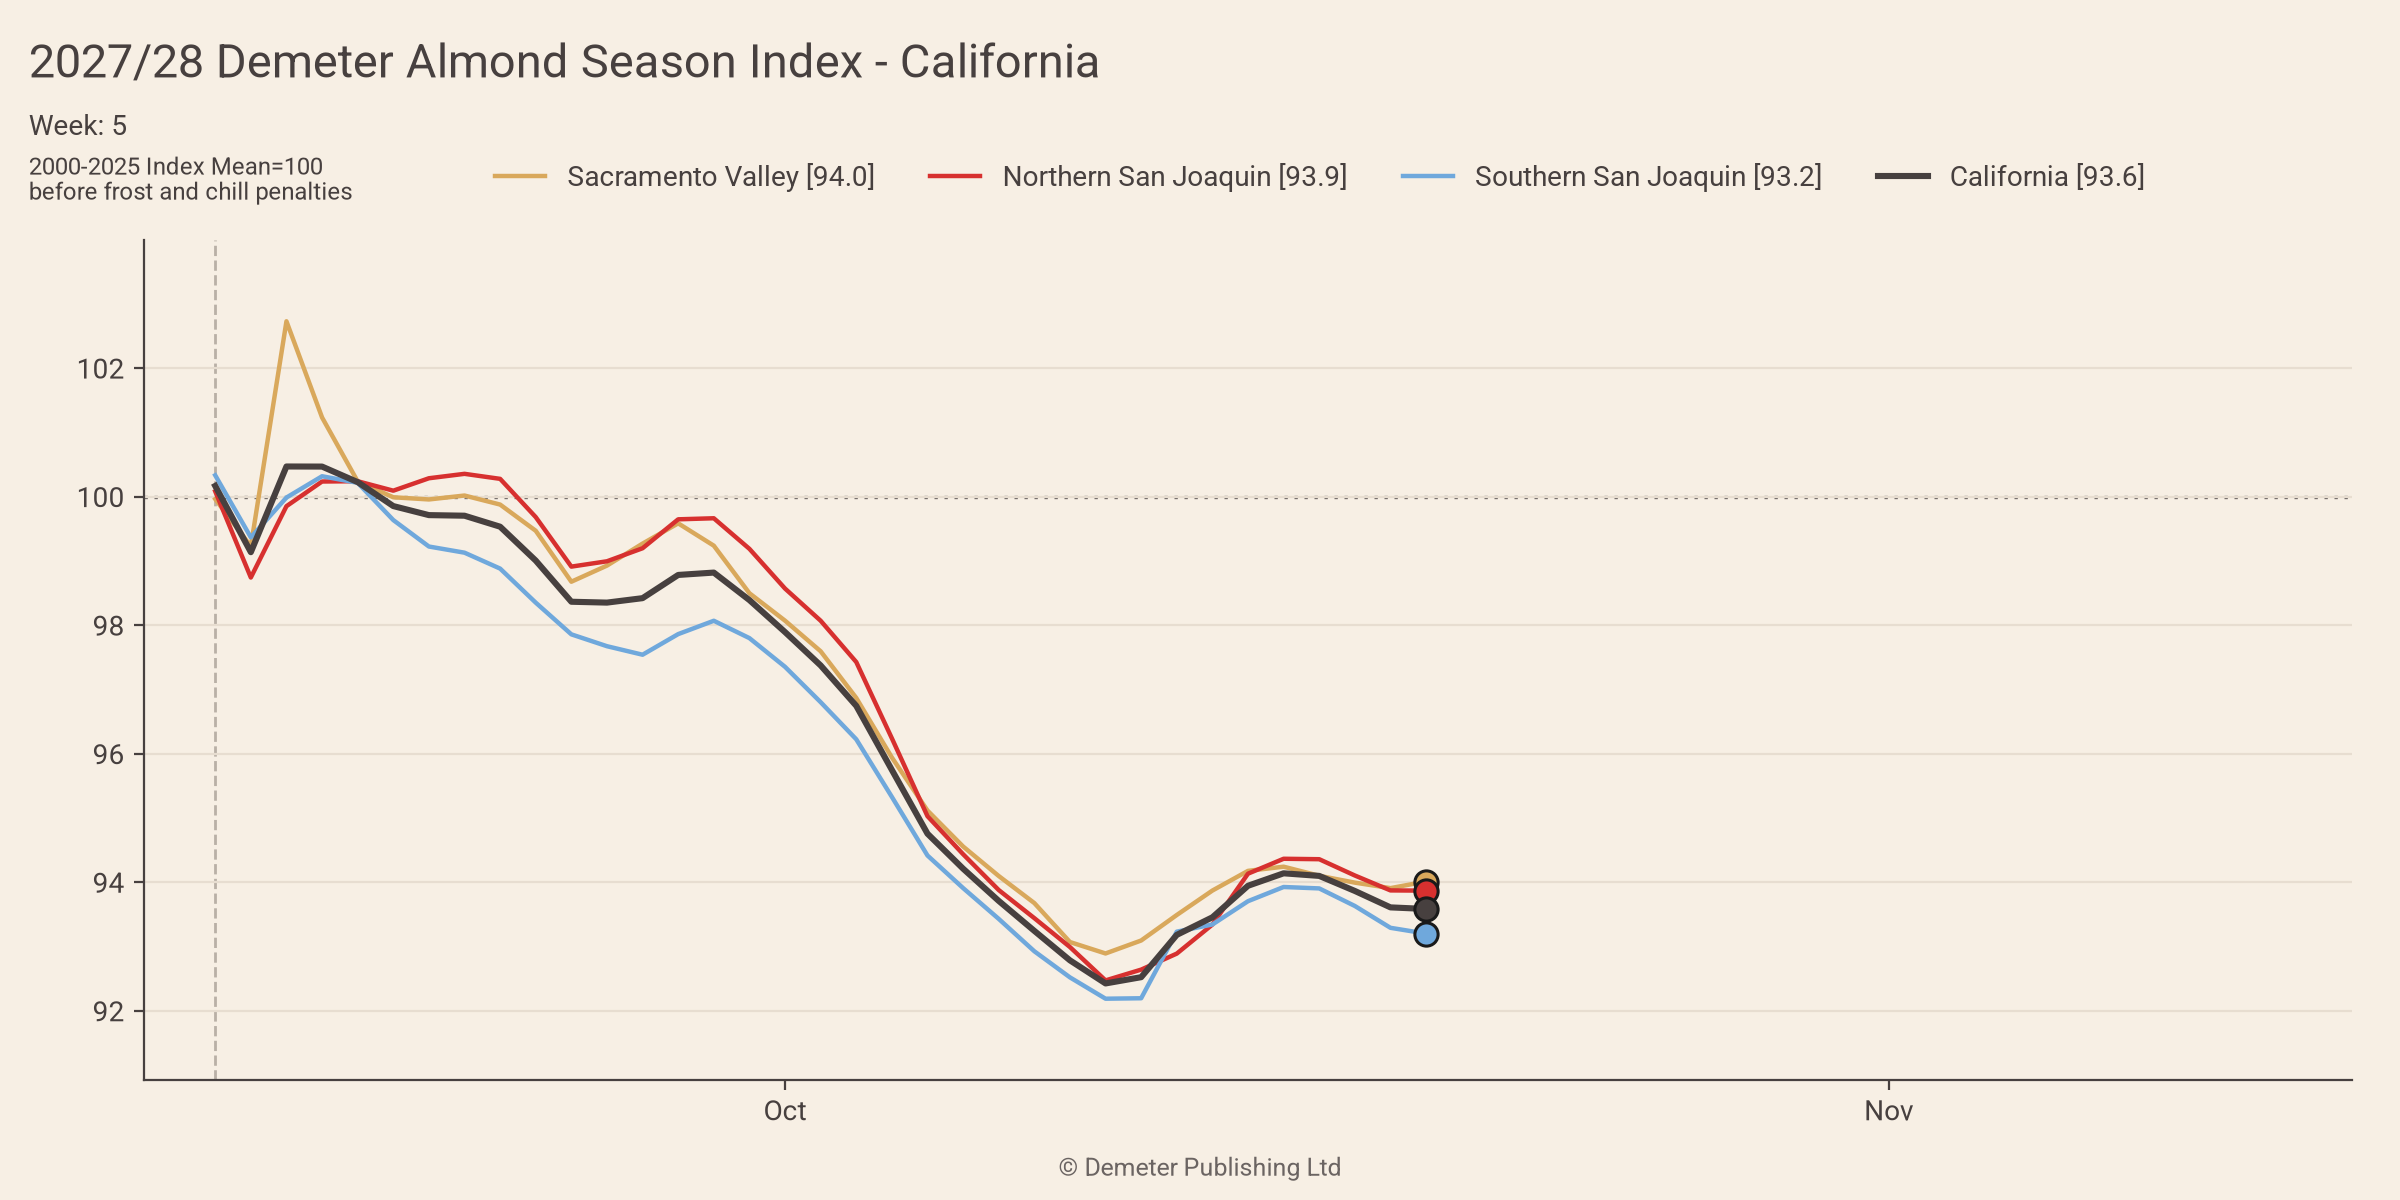
Demeter Almond Season Index Update - California, Week 5
California stands at 93.6 in week 5, 1.2% lower than the last publication.
Forecasts
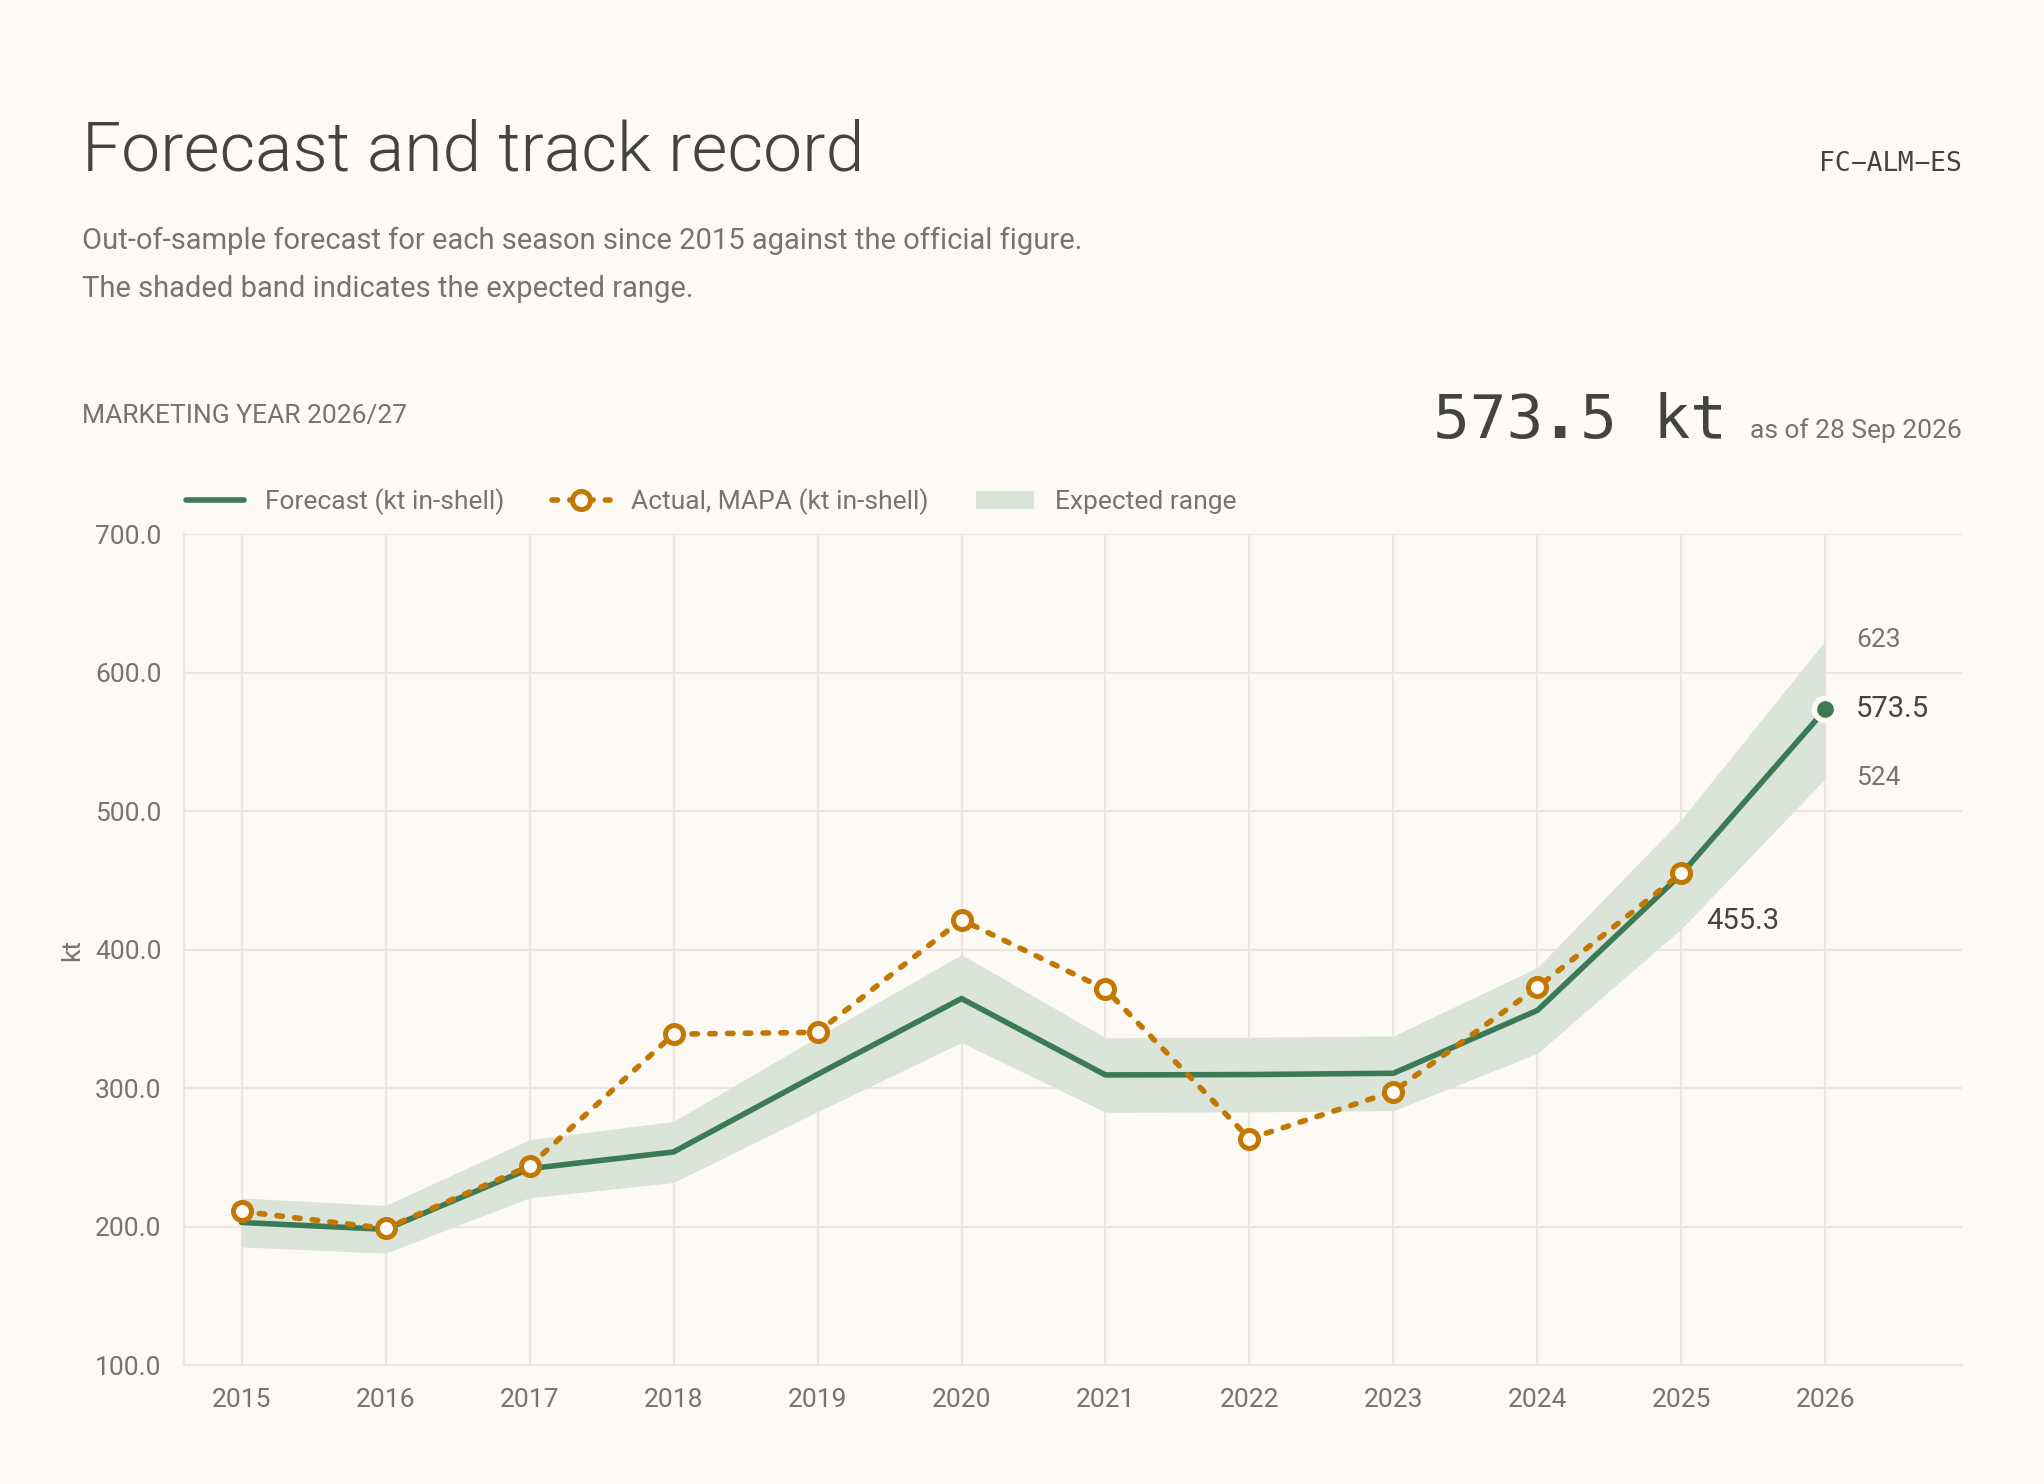
Spain Almond Production Forecast 2026/27
Demeter forecasts Spain almond production for 2026/27 at 172,050 tonnes of kernel (573,500 t in-shell), 26% more than in 2025, from 699,000 ha at bearing age. Expected range 157,000–187,000 t kernel.